
Swing Trading Strategy
All of these strategies are based on setups that contain a prior market reading context with similar or, even, more important than the pattern itself. So we recommend learning to contextualize the market with Forex Academy traders, to always grasp which situation we are in.
That said, let’s see what this strategy is about and how could we apply it to the market.
Swing Trading is a kind of strategy that works in relatively long time frames, leaving trades open from one session end to the next one. It usually trades with the trend; so we position ourselves in favor of the dominant market bias; thus, the first and most crucial task is to identify it.
If we are trading on a bull market we will buy, on a bearish market, we will sell.
You need to understand that we must not buy at peaks nor sell at bottoms. We always have to wait for a retracement.
Let’s review using visual examples the best way to enter using this long-term trend strategy.
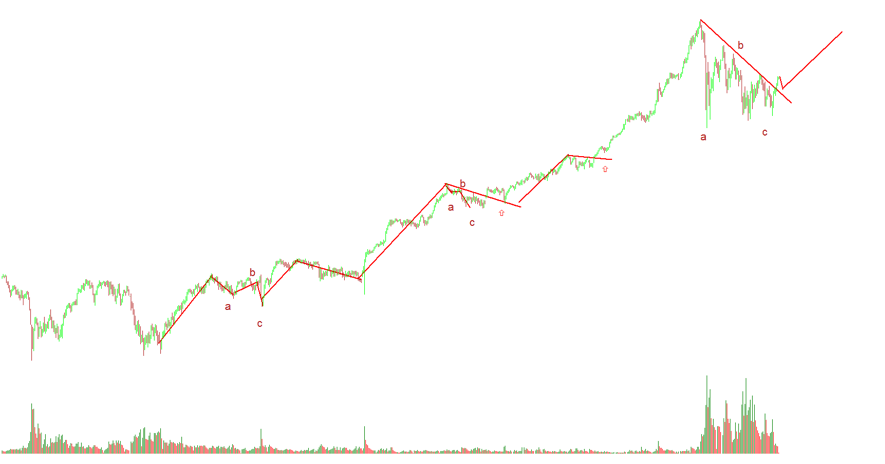
Here we observe a daily Dow Jones chart. The trend is clearly bullish, so our first requirement has been met. Now we need to wait for a retracement and detect its conclusion to enter a long position.
The easiest to identify are those retracements that develop into three smaller waves. In short time frames you can enter C-waves directly, but using this type of trading it is best to wait for the price to break the bearish guideline that signals the correction, and then, enter on its pullback in favor of the dominant trend (long in this case).
Please note the two red arrows on this chart, one close to its centre, where the price breaks the bearish trendline and continues its upward trend, for a very good long entry, and another one at the end of the chart, where it is currently breaking its corrective guideline again, to a priori, continue seeking fresh new highs. Therefore, we should remember that our first job is to identify the trend in a longer timeframe, and then identify the pullbacks and the guideline that forms them. Watch the break-out of this guideline and subsequent pullback to enter the market.
Let’s see another example: