Binance Coin (BNB)
Market Cap. $1.61B
Circulating Supply: 114.04M BNB
Max Supply: 0 BNB
Volume (24h) $78.38M
Binance Coin went down a bit and seems undecided right now because is hovering right above a very strong dynamic support. It remains to be seen what will really happen in the upcoming days because the price seems exhausted and could start a corrective phase. Right now it is premature to talk about a corrective phase because the rate could still recover after a false breakdown.
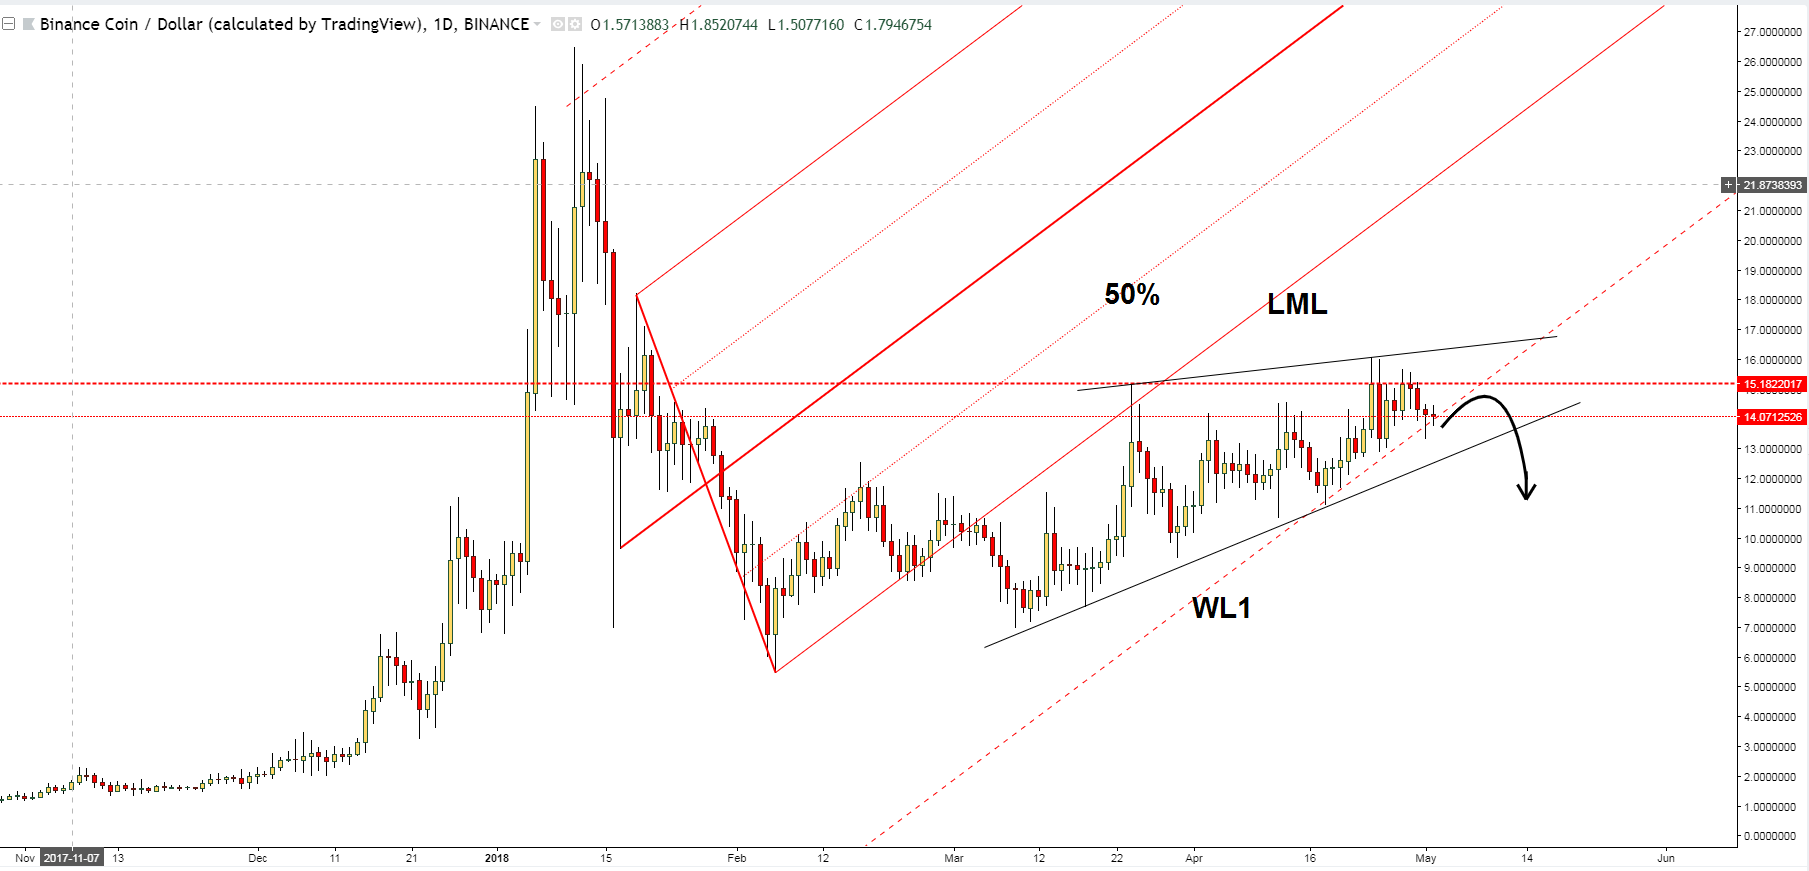
BNB/USD price increased in the previous weeks but has made another false breakout above the 15.1822017 static resistance signaling a potential drop. We have a bearish divergence on the Daily chart that’s why we could think of a significant drop.
We should wait for a selling opportunity. This could be confirmed by a valid breakdown below the first warning line (WL1) of the ascending Pitchfork. Price has moved away from the lower median line (LML) of the ascending Pitchfork and now has managed to close almost on the WL1.
You can notice that the rate has developed a Rising Wedge pattern, so only a breakdown will confirm a significant corrective phase. You should stay away from this crypto because a false breakdown below the WL1 will send the rate much above the 15.1822017 static resistance. A buying opportunity may arise after a valid breakout above the upside line of the chart pattern.
Conclusion
You can see this crypto after a valid breakdown below the WL1 or after a breakdown from the Rising Wedge pattern.
©Forex.Academy
