
Forewords
All these strategies are based on setups that have prior market reading knowledge, which is just as important as the pattern itself. We recommend you to learn using Forex Academy’s educational articles and videos to contextualize the market, so you are always aware of the present situation.
That said, let’s see what this strategy consists of and how we apply it to the market.
The Strategy
A confluence is nothing more than a price level where two or more key levels converge that act as support or resistance. If you are in a Bull market context, and you see that the price falls back to an area where two or more supports come together, you will have a pattern to enter the market long.
We are going to see some real examples in the graphs so that we can understand better what we are showing.
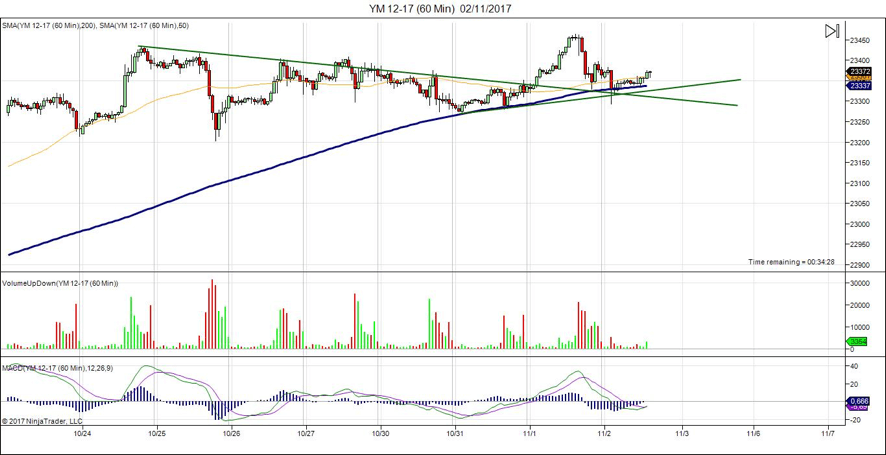

On this chart, we see the Dow Jones index in the 60-minute timeframe. A few days ago, the price had decreasing highs, which allowed us to draw a bearish trendline. That trendline was broken with an upward momentum, which turned the old resistance into a possible future support zone if the price were to pull back on it.
Looking at the short term, we also observe that the latest market lows were increasing, a situation that always calls for a bullish trendline. We see on the chart that there is an exact place where these two guidelines converge and that the price comes to a support level near this figure. This gives us a very good area to enter a long position, protected by two supports. Also, in the graph, we can see that the 200-period Moving Average is moving just below it, which provides even more value to the area.
Let’s see another example, but with resistance in this case.
In this image, we can see the 1-minute DAX index chart. We observe how the price is producing decreasing highs, which allows us to draw a bearish trendline.
In the first half of the current session, the price opened with a bearish gap and closed with bullish momentum. Then the market turned down to a bearish momentum that ended with a false dilation of the lows. If we draw the Fibonacci retracements on that bearish momentum, we can see how the Fibo-62 guideline converges in the same area, creating an important resistance where the price is likely to rebound. The red arrow would show the short-entry zone in this case.
In these two examples, there is no indication of whether we have a context for or against because that requires a much more in-depth analysis of various times frames. But as we have already mentioned, to learn how to assess the context, you will need to study on live markets with the help of experienced traders.
If you combine a favorable context, that is, a setting showing you the likely direction of the market, and a zone of confluences where the market can support and continue to favor the context, you would be able to build very powerful setups.
© Forex.Academy


